Blog post
Blog Post
New Render Blocking Indicator in Chrome and WebPageTest
Thanks to a new indicator provided by Chrome in their traces, we're now able to highlight whether a request is render blocking or not. Learn more about the new indicator and what it can tell us.
Thanks to a new indicator provided by Chrome in their traces (starting in version 91 of the browser, with a notable bug fix shipping with version 92 today), we just started highlighting all render-blocking requests in our waterfalls, making it easier to quickly zero-in on blocking requests that may be causing significant bottlenecks in your page's performance.
One of the most common performance bottlenecks that sites run into are delays caused by render-blocking resources: resources in the page that stop the page from being displayed until they have been downloaded, parsed and (in the case of JavaScript) executed.
Here's the gist: certain types of resources—CSS and JavaScript—are blocking by default.
In the case of CSS, the browser can't display the page until that CSS has been downloaded and parsed into the CSSOM.
In the case of JavaScript, the browser can't even continue parsing HTML, let along display the page, until the JavaScript has been downloaded, parsed and executed.
In either case, blocking resources tend to push out the Start Render and First Contentful Paint times in particular (and Largest Contentful Paint by association). If your site has render blocking resources, loading them lazily or making them load asynchronously will result in a sizable performance improvement.
Sia Karamalegos just published a fantastic post about render-blocking resources last week that is well worth your time if you want to learn more in detail.
It can be a little tricky to spot render-blocking resources at a glance, but that's where Chrome's new Render Blocking status indicator comes into play.
The renderBlocking flag
As of Chrome version 91, Chrome now tags any relevant requests with a renderBlocking flag, indicating whether or not that resource is blocking. Having this information provided by the browser is a big step forward. There have been a few attempts by tools to identify render blocking resources using their own heuristics, but getting that information directly from the browser provides a higher level of accuracy as well as more granularity.
The flag has five different potential values:
- blocking
- non_blocking
- dynamically_injected_non_blocking
- in_body_parser_blocking
- potentially_blocking
The blocking status
This one is pretty straightforward—if the request blocks the page from being displayed, then the blocking status is reported as "blocking". This label gets applied to things like stylesheets and script elements that don't have a defer, async, or module attribute.
The non_blocking status
This one is also pretty straightforward. If the request does not block the browser from displaying the page, then the blocking status is reported as "non_blocking". This label applies to things like stylesheets with a disabled attribute or stylesheets with media queries that don't match the current environment (such as print). It would also apply to scripts that have a defer or module attribute.
The dynamically_injected_non_blocking status
This can more or less be considered the same as non_blocking, at least from a performance impact perspective. This status is applied to a resource that is dynamically injected in the page, and does not block the display of the page.
This status currently doesn't get applied to dynamically injected scripts, but that's a relatively minor bug—"dynamically_injected_non_blocking" is just a more specific version of "non_blocking" so while it will be nice to see this cleaned up in the future, it's a mostly insignificant issue.
The in_body_parser_blocking status
The "in_body_parser_blocking" status set whenever the resource is requested from somewhere within the body in a way that blocks the parser from parsing the document below the element.
So, for example, let's say you have a script element inside the body of the page instead of the head. That blocks the browser from parsing anything below that element until the resource has been requested and downloaded, so this status gets applied.
The potentially_blocking status
This is a pretty interesting one. If Chrome can't say for certain that the request will or won't block the page from display, then the "potentially_blocking" status gets applied.
A good example here is an async script. If a script is loaded with an async attribute, the browser executes the script as soon as it arrives. That means if the script arrives quickly, before the initial render of the page, then the script blocks rendering until all execution is completed. If the script arrives after the initial render of the page, then it was non-blocking. Since the blocking nature depends on when the script arrives, Chrome can't tell at request time if it will be blocking or not, so it flags it as "potentially_blocking".
How to find the render blocking status in WebPageTest
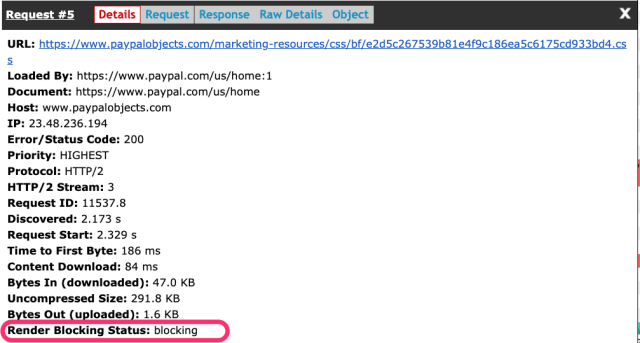
When you click on a request in a waterfall to view the full request details, we display the render blocking status wherever it's applicable in the dialog box that appears.
That's been hiding in plain sight for a bit now, but when we were testing the indicator in Chrome v91, we identified a bug where dynamically injected async scripts were being incorrectly flagged as blocking. Yoav from the Chrome team jumped on it quickly, getting the fix out for version 92.
There's still one more bug that we identified that won't be fixed until version 93 (preload requests are flagged as non-blocking, even if they are for a blocking resource) but the flag is stable enough that we're comfortable making it a bit more prominent now.
With the indicator becoming a bit more stable, we've also made it a bit more prominent. Starting today, resources that have a "blocking" status will be called out with an icon, making it easy to identify any render blocking resources at a glance.
We're currently not showing anything if a resource is flagged with either "potentially_blocking" or "in_body_parser_blocking", but if that's something you would find helpful, we're all ears. For example, one thing we're considering is flagging all "potentially_blocking" resources that arrive before start render occurs. They're not quite the same as "render_blocking" resources since they may not always block render on every test, but the fact that they flare up sometimes to slow things down could be helpful information.
Take it for a spin
We've had requests for a render blocking indicator of some sort for awhile now, and we're excited about the level of accuracy and granularity a flag served directly by the browser can provide. Please play around with a few tests and let us know if there's anything you'd love to see to make it easier for you to identify and fix any render blocking related issues.
July 20, 2021


Tim Kadlec
This is some text inside of a div block.